25/04/2016 New LARC features
This week we have also added some new features to the LARC:
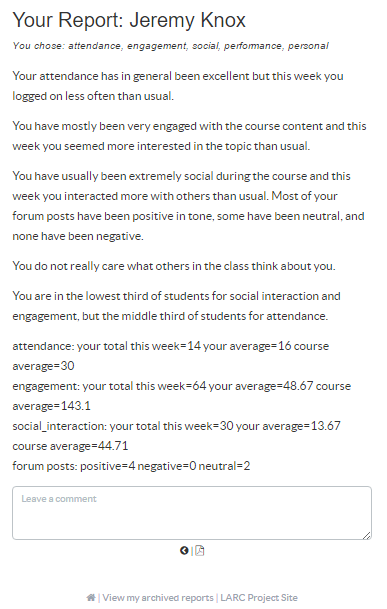
- Choice options (attendance, engagement, social interaction etc) now appear underneath the report title. This helps with the archiving of reports, so users are reminded about which choices were selected for a given report.
- We’ve added some sentiment analysis related to the ‘social interaction’ option, so an additional sentence has been added to the report, commenting on the tone of forums posts.
- We’ve added a rough breakdown of the numbers used underneath the report. This shows some of the data used to generate the text of the report and displays the user variable as well as the group average, allowing users to understand a bit of the context in which particular report statements have been made.
Here is an example of a LARC report incorporating the new features:
28/03/2016 Initial data analysis
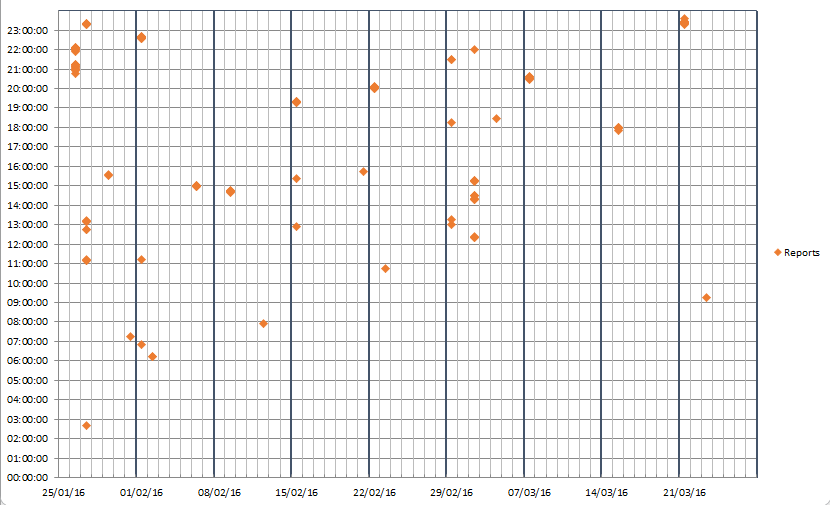
Early analysis of the pilot data is revealing some potentially interesting insights. Firstly, an examination of when reports are generated appears to be a useful question to ask of the data. Given that the LARC is intended to be a form of analytics that students can generate ‘at will’, evidence of regular interest is valuable. The following graph shows data from the first 9 weeks of one of the pilot courses, and perhaps most significantly the days of the week in which reports were generated.
What this shows is some regularity in the generation of reports, but also perhaps a tendency to make use of the LARC towards the beginning of the week. This is significant because the LARC works with weekly sets of data. In other words, Monday would be the first opportunity to view the report for the previous week.
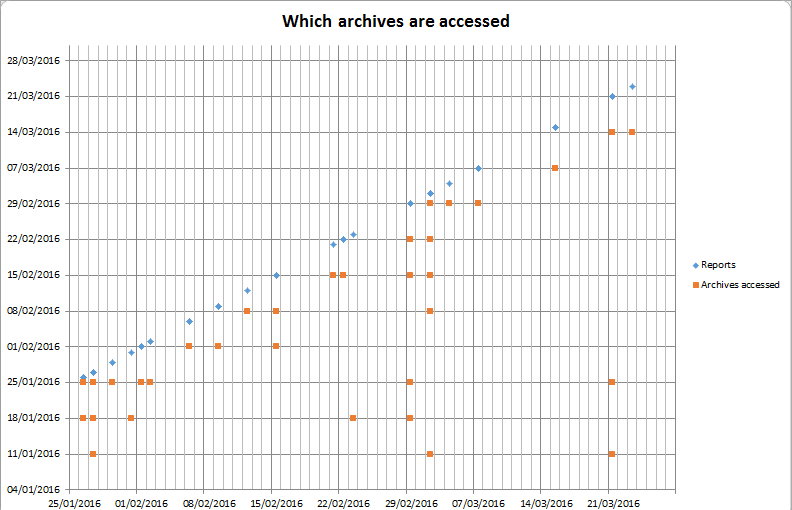
Additionally important here may be the range of archived reports accessed each time reports are generated. So, while the LARC reveals data from the previous week’s activity, it also provides the means to look back at older reports. The following graph shows some of this activity from the same pilot course.
Here, while there appears to be a consistent generation of reports from the previous week, there also may be some interest in the archive, and comparing different reports. This may reveal some interest in considering progress over time, and how the reports might demonstrate alterations in behaviour.
12/02/2016 Welcoming Research Methods students to the LARC pilot
This week the Research Methods course has entered a 3 week period of exploring various different approaches to educational research, and we are delighted to include Learning Analytics as one of the options that students can investigate. As part of this route, we’re offering Research Methods students the chance to try the LARC with their course data. It is excellent to have a different group of students on the LARC pilot, and the potentially different perspectives they may bring to the early stages of the project.
Research methods students have been asked to reflect on the following questions when using the LARC:
- Does the report provide an accurate reflection of how you feel you participated?
- How might it affect how you participate with the rest of the course, or engage in future online courses?
- How do you feel about receiving ‘automated’ feedback generated by an algorithm, as opposed to feedback provided by a tutor?
- To what extent do you feel ‘in control’ of the learning analytics process, given that you can choose which data to include in your report?
- What do you feel about institutions collecting, storing, and potentially utilising this data? (N.B. this data will be collected and presented to you exclusively for this task, and we as a programme team do not analyse this data routinely.)
18/01/2016 Pilot now under way!
The LARC interface is finally ready for pilot testing in semester 2. A group of students from Understanding Learning in the Online Environment (ULOE) have kindly agreed to act as research participants for the next 12 weeks or so. During the course, they will be able to generate reports using the LARC each week, and these should comment on their progress with ULOE. The LARC has been initiated this week, and first reports will be available from Monday 25th.
Given the particular focus of ULOE, we feel the LARC is well suited to the course themes, and the kinds of readings and activities the students will be undertaking. We hope students will reflect on the automated feedback and the quality of its relationship to their perceived learning throughout the course.
11/12/2015 Initial LARC interface complete
The first draft of the Learning Analytics Report Card interface is complete, and is ready for testing with Moodle data and the phase 1 analytics. The interface is behind the EASE login, which will restrict access to the identified pilot students, as well as facilitate login information for the data capture from Moodle. At present, the options available to students reflect the 5 categories of analytics constituting the fist phase of development: Attendance, Social Interaction, Engagement, Performance, Personal.
Tick boxes allow the student to select which areas to take forward into their report. Once at least one option has been selected, the report will be generated on a subsequent screen.
This is example text, which will eventually be populated through the data-to-text processing of the LARC.


